



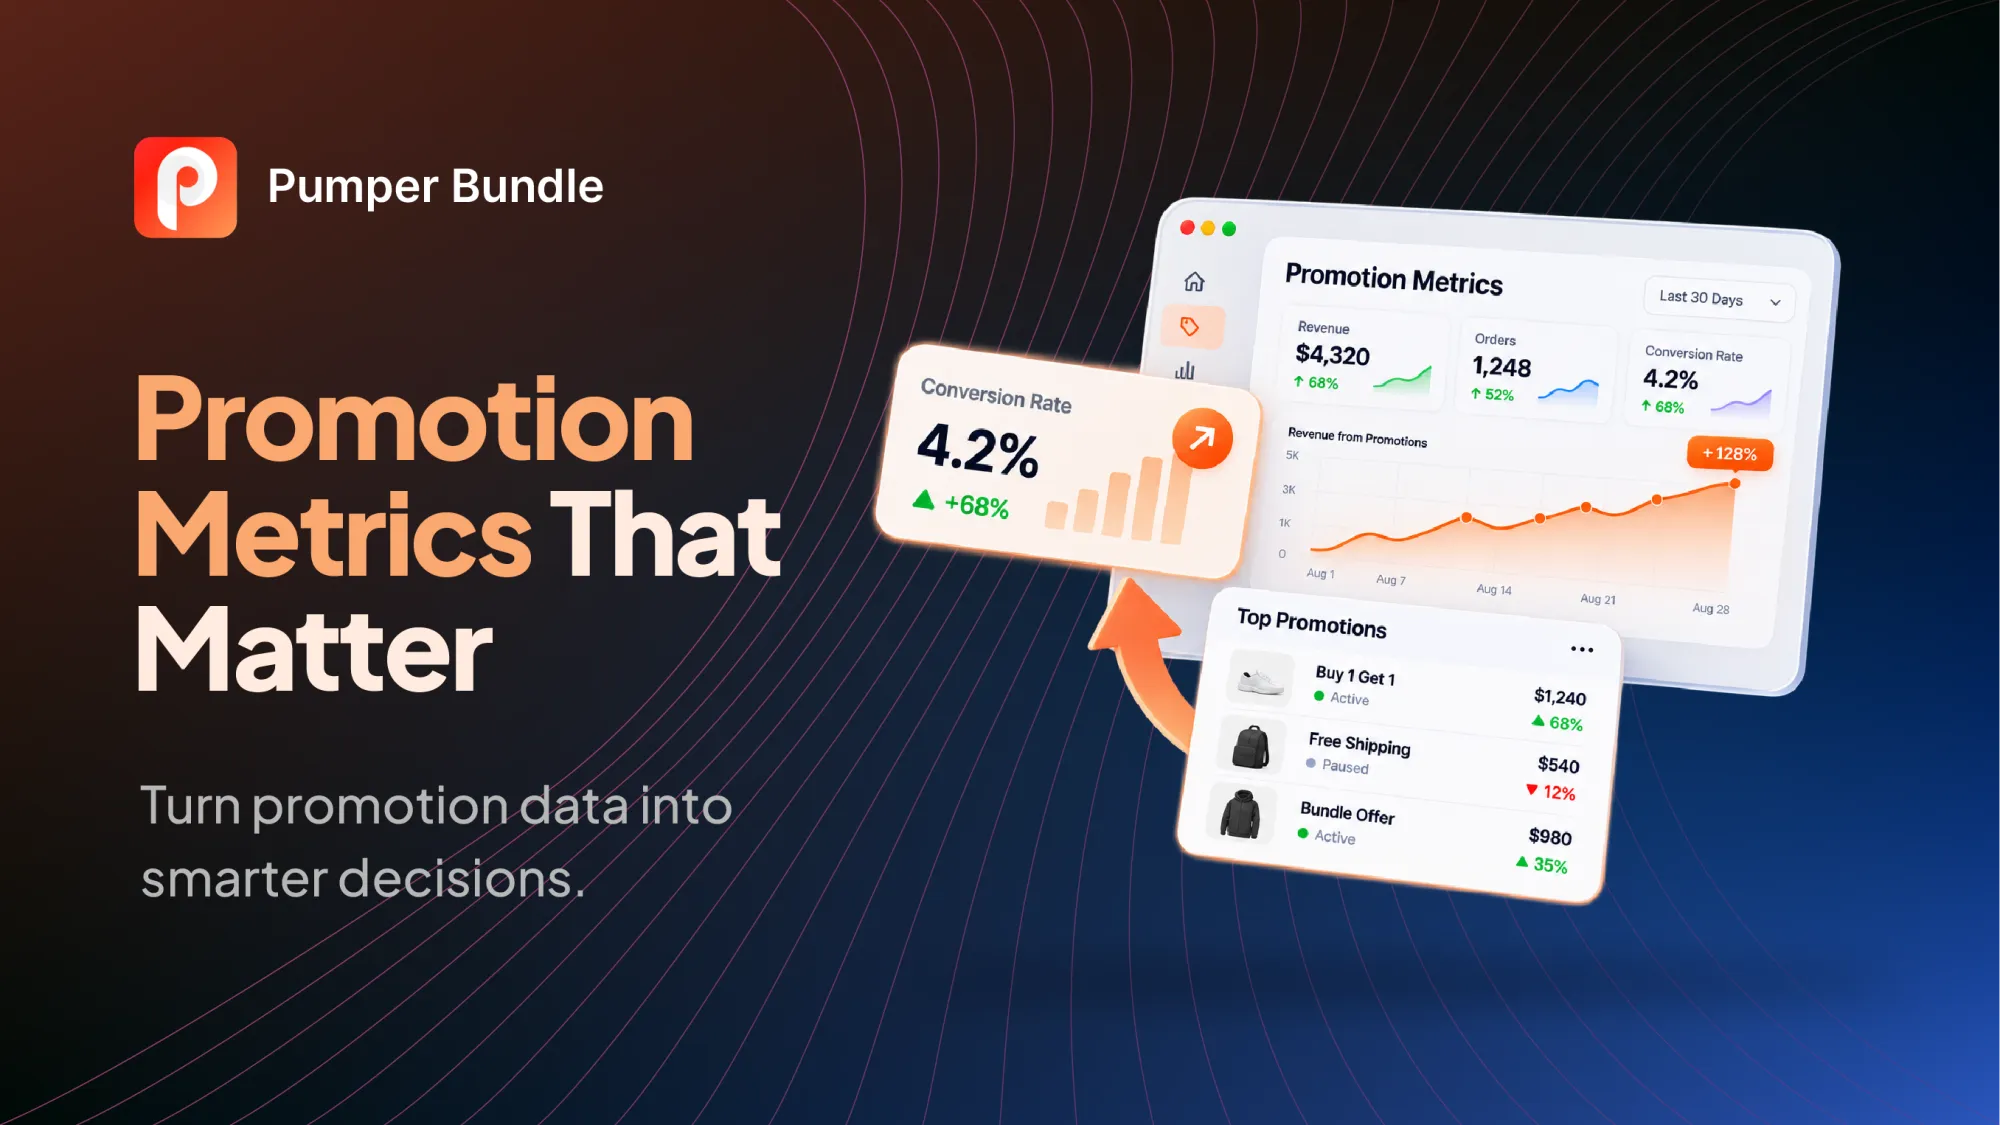
A promotion that doubles your revenue for a weekend can still leave you worse off by Monday. The revenue line counts every order the same, whether it came from a new customer, a loyal one who would have paid full price, or a shopper who was going to buy next week anyway.
The metrics below separate those cases. They cover profit, basket, funnel, customer behavior, and the cost leaks that show up weeks later as returns and a quiet reorder rate. Each comes with a formula, a place to find it in Shopify or Pumper, and the pattern that should make you look closer.
You don't need all twelve for every promotion. Start with the first three, add the group that matches your offer type, and use the later sections to turn the numbers into a decision.
Key Takeaways
- Revenue overstates a promotion's value. Van Heerde, Leeflang, and Wittink found about one-third of a typical promotion bump came from demand pulled forward from other periods.
- Profit per visitor is the single best summary metric, since it nets out the discount, the added units, and the change in conversion in one number.
- The unit lift a discount must produce to keep gross profit flat is the discount divided by the margin left after it. A 20% discount at a 40% margin needs 100% more units.
- Shopify's average order value excludes post-order adjustments, and its sales-by-discount report can count one order several times, so read both with those rules in mind.
- Check the repeat-purchase rate for 60 to 90 days after the promotion, because the cost of a deep discount often lands there.
Why Revenue Alone Misleads
Revenue grows when more people buy, when each person buys more, or when the price rises. A discount lowers the price, so any revenue gain has to come from volume, and volume from a promotion comes from three sources. Some shoppers are new, some would have bought anyway, and some bought early.
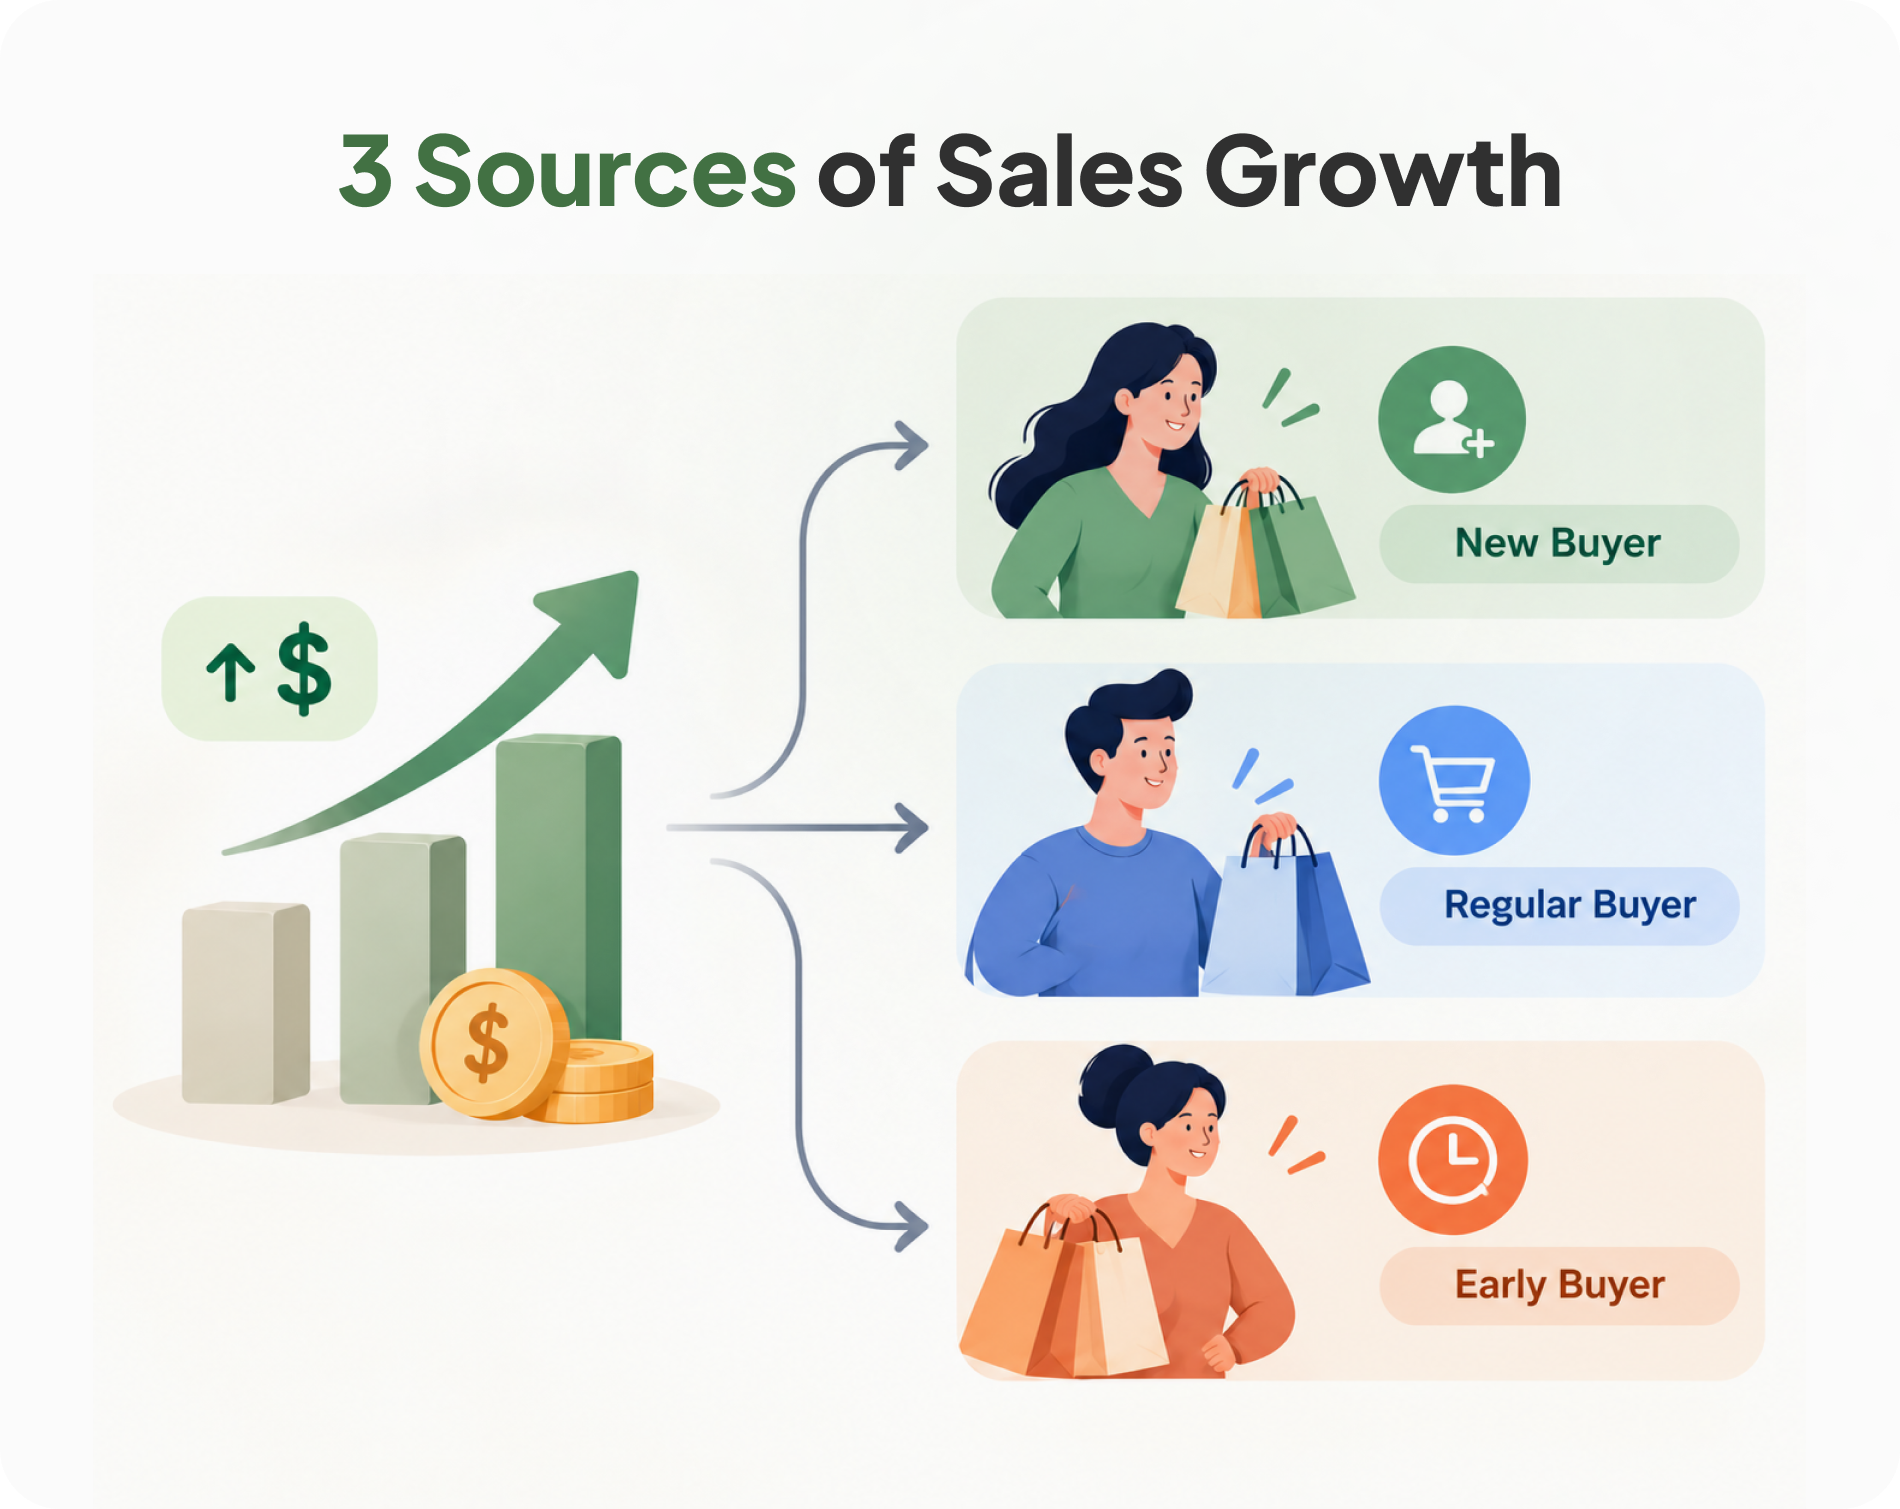
The third group is easy to overlook. Hendel and Nevo estimated a dynamic model of consumer stockpiling on two years of household scanner data. They found models that ignored stockpiling overstated own-price elasticities by 30% (Hendel & Nevo, Econometrica, 2006). In plain terms, shoppers who stock up during a sale make demand look more price-sensitive than it is, because the purchases come out of future weeks.
The practical consequence is that a promotion report needs a before and an after. Everything in this guide is built to give you both.
Profit Metrics to Start With
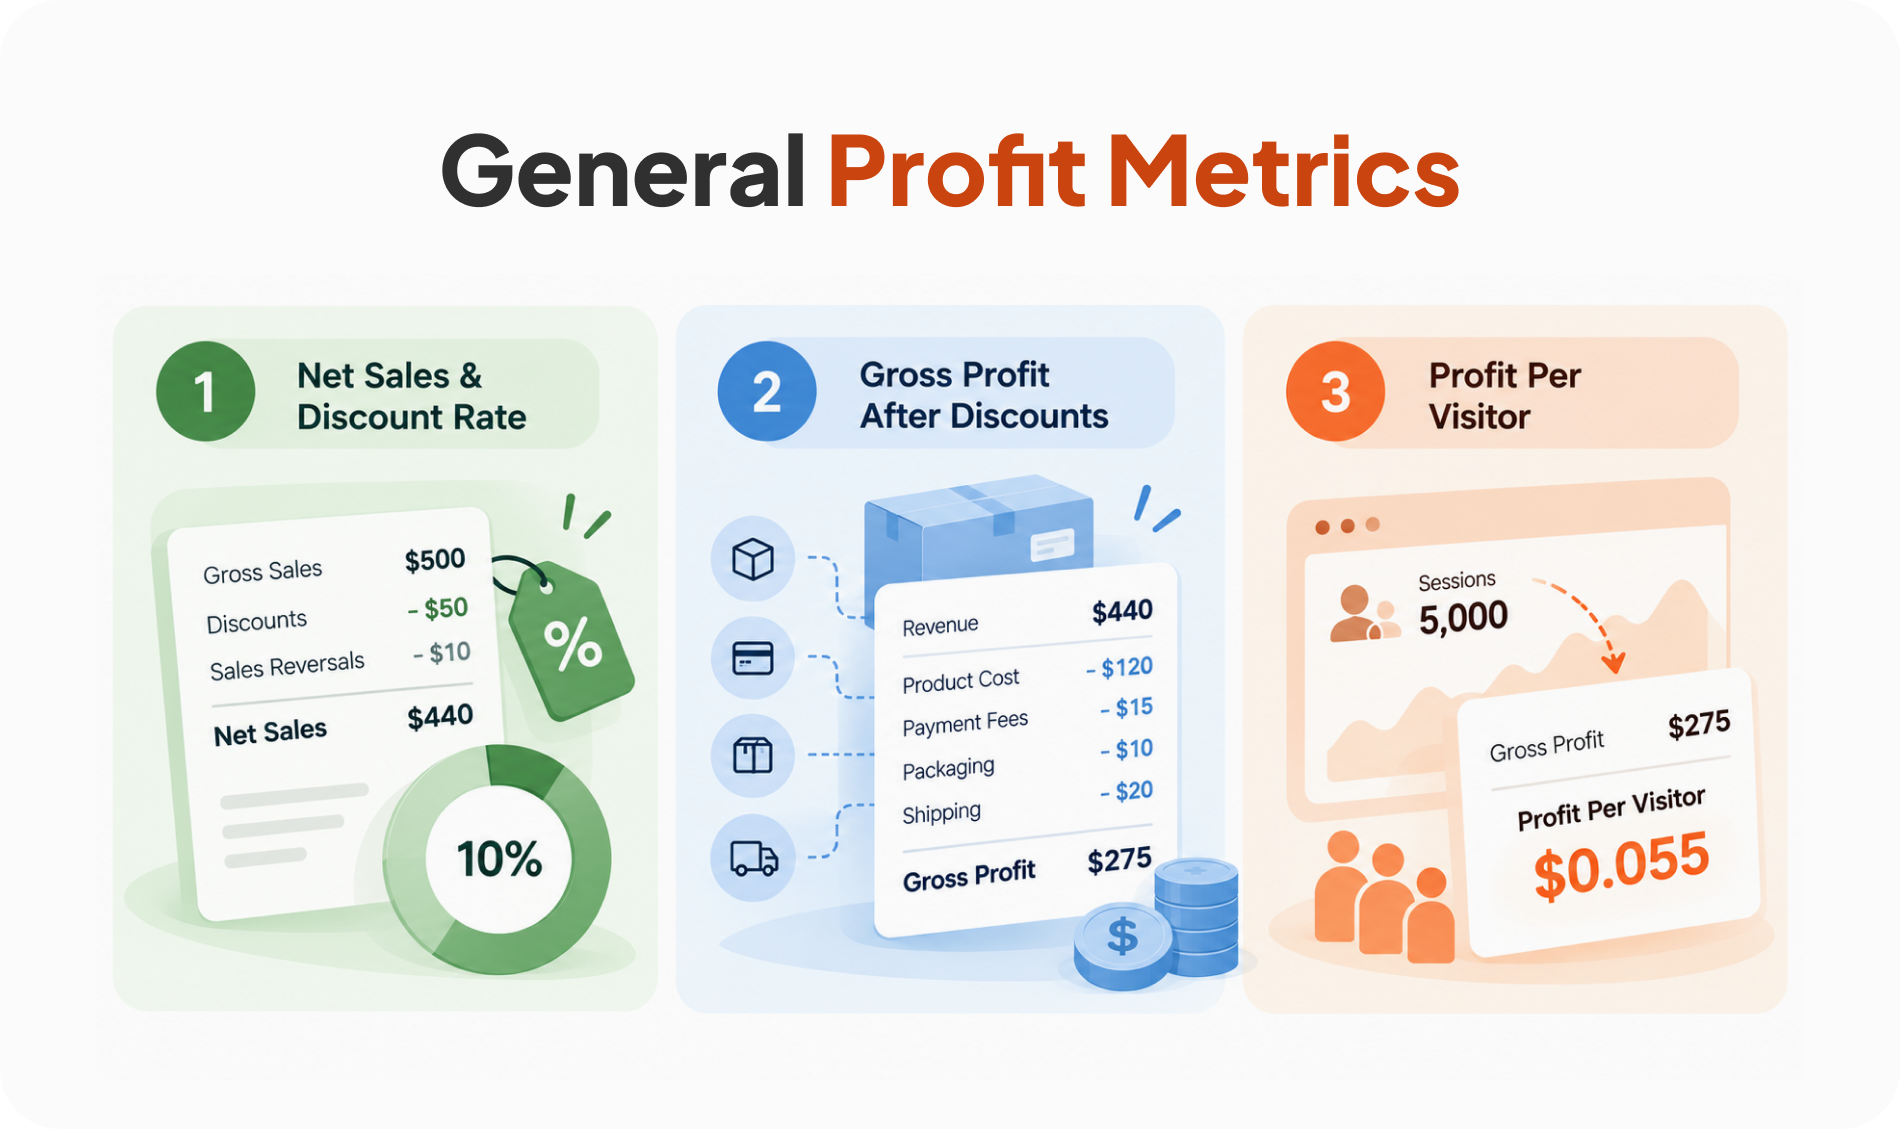
1. Net Sales and Discount Rate
Shopify defines gross sales as price times quantity before taxes, shipping, discounts, and sales reversals. Discounts are the total reduction from discount codes and automatic discounts, and net sales are gross sales minus discounts minus sales reversals (Shopify Help Center).
From those, calculate the discount rate: discounts divided by gross sales. A promotion that lifts gross sales while pushing the discount rate sharply higher is buying revenue with margin. Track the rate for the promotion window and compare it with your trailing 90-day figure.
2. Gross Profit After Discounts
Gross profit after discounts is revenue minus product cost, payment fees, packaging, and absorbed shipping, summed over the window. Shopify’s net sales stop before product cost, so this figure needs your cost data, either from Shopify’s cost-per-item field or a spreadsheet. It’s the number that tells you whether the promotion paid for itself.
3. Profit Per Visitor
Divide gross profit after discounts by sessions. This metric nets out the discount, the units added, and the change in conversion together, so it settles most disagreements about whether a promotion worked. An offer with a lower conversion rate and a higher profit per visitor is the better offer.
Pumper's guide to quantity break pricing shows how to price tiers from marginal cost, which gives you the cost side of this calculation before launch.
Basket Metrics for Offers That Change Quantity
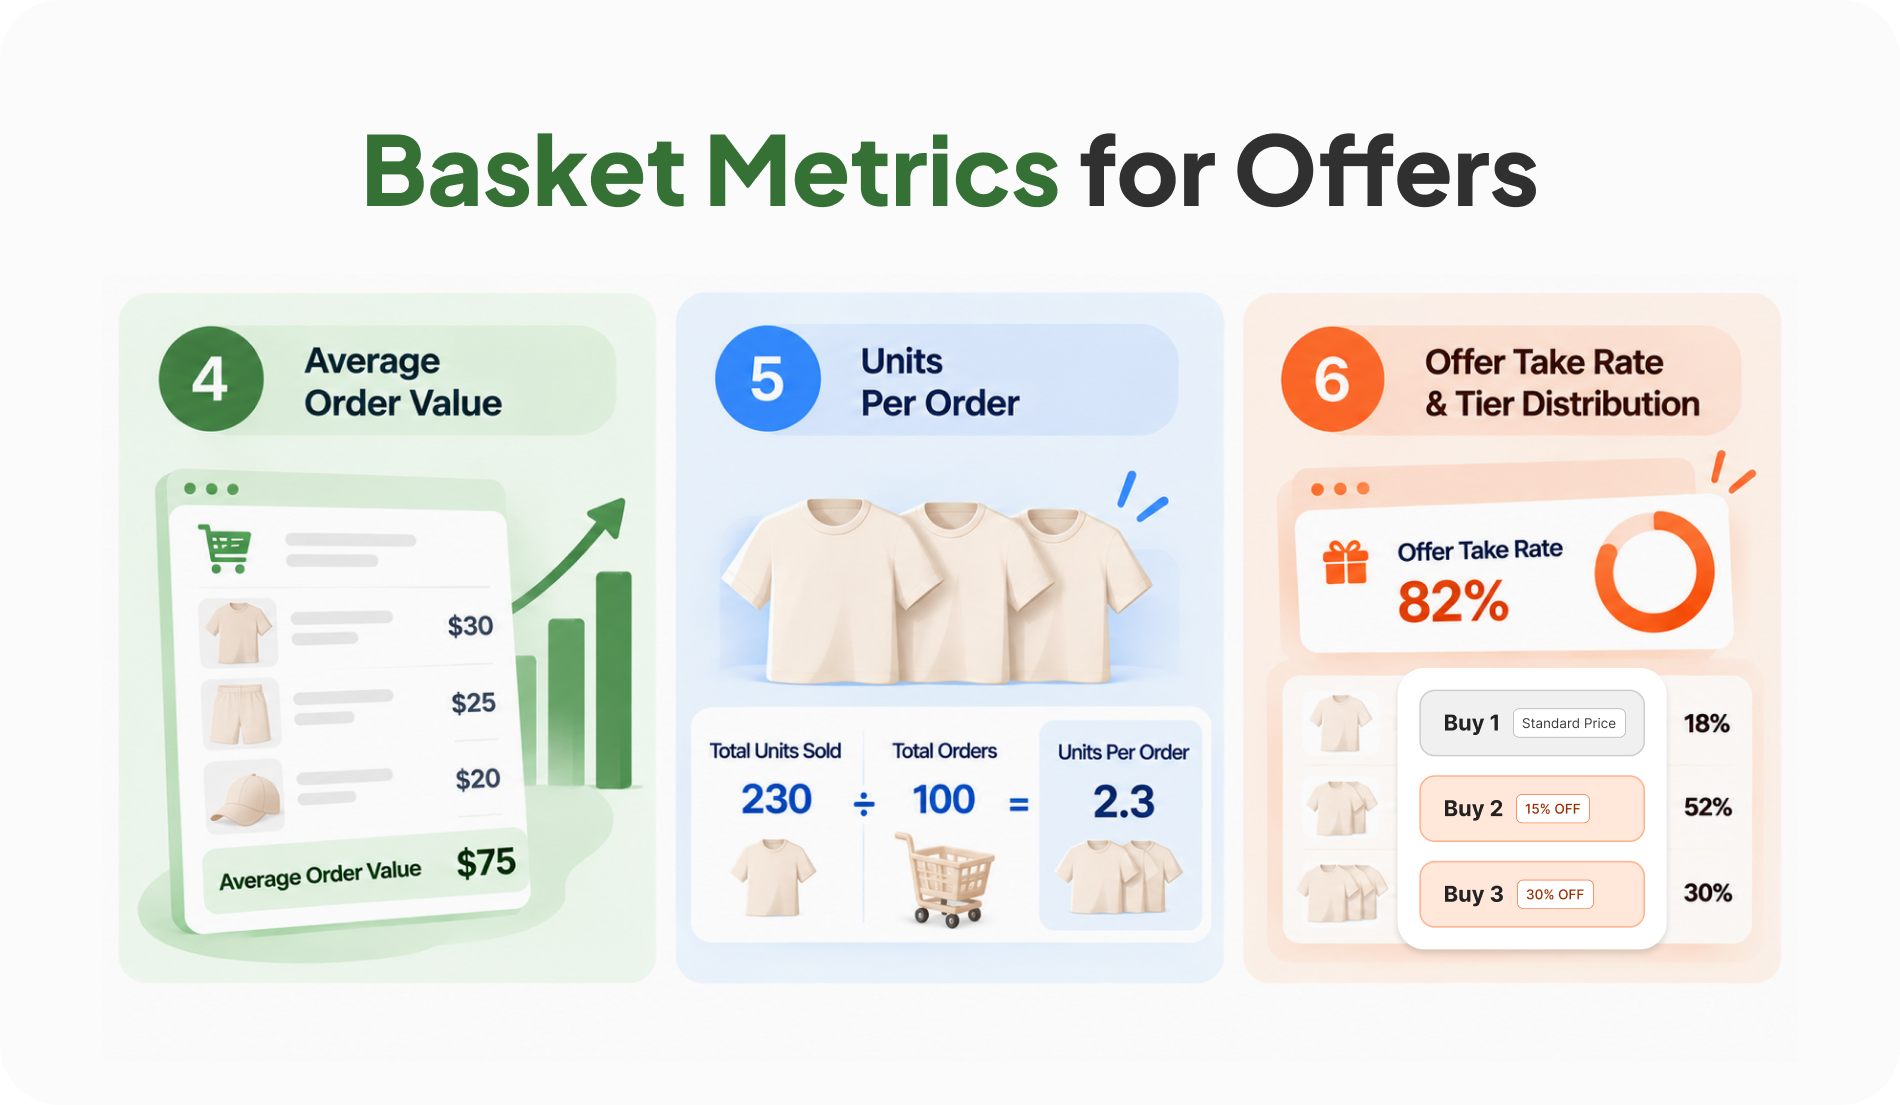
4. Average Order Value
Shopify calculates average order value as gross sales minus discounts, excluding post-order adjustments such as edits or exchanges, divided by the number of orders. That means a refund processed later doesn't reduce the figure for the original order date, so a promotion with heavy returns can show a flattering AOV.
Compare AOV for the promotion window against the same weekday mix from the prior period. Pumper's guide to increasing average order value on Shopify covers seven levers and how to read each lever's effect on this number.
5. Units Per Order
Total units sold divided by orders. AOV can rise from price changes or mix shifts, while units per order moves only when shoppers add quantity. For quantity breaks, bundles, and BOGO offers, this is the clearest direct signal that the offer is doing its job.
6. Offer Take Rate and Tier Distribution
The share of eligible orders that used the offer, and for tiered offers, the share landing on each tier. A tier ladder where nearly every order lands on the first rung needs a different default or a different price gap, and a ladder where nearly every order lands on the top rung may be priced too generously. Pumper's dashboard shows which tiers customers reach, and the BOGO sale ideas guide explains how different formats shift that distribution.
Funnel Metrics for Finding Where Shoppers Stall
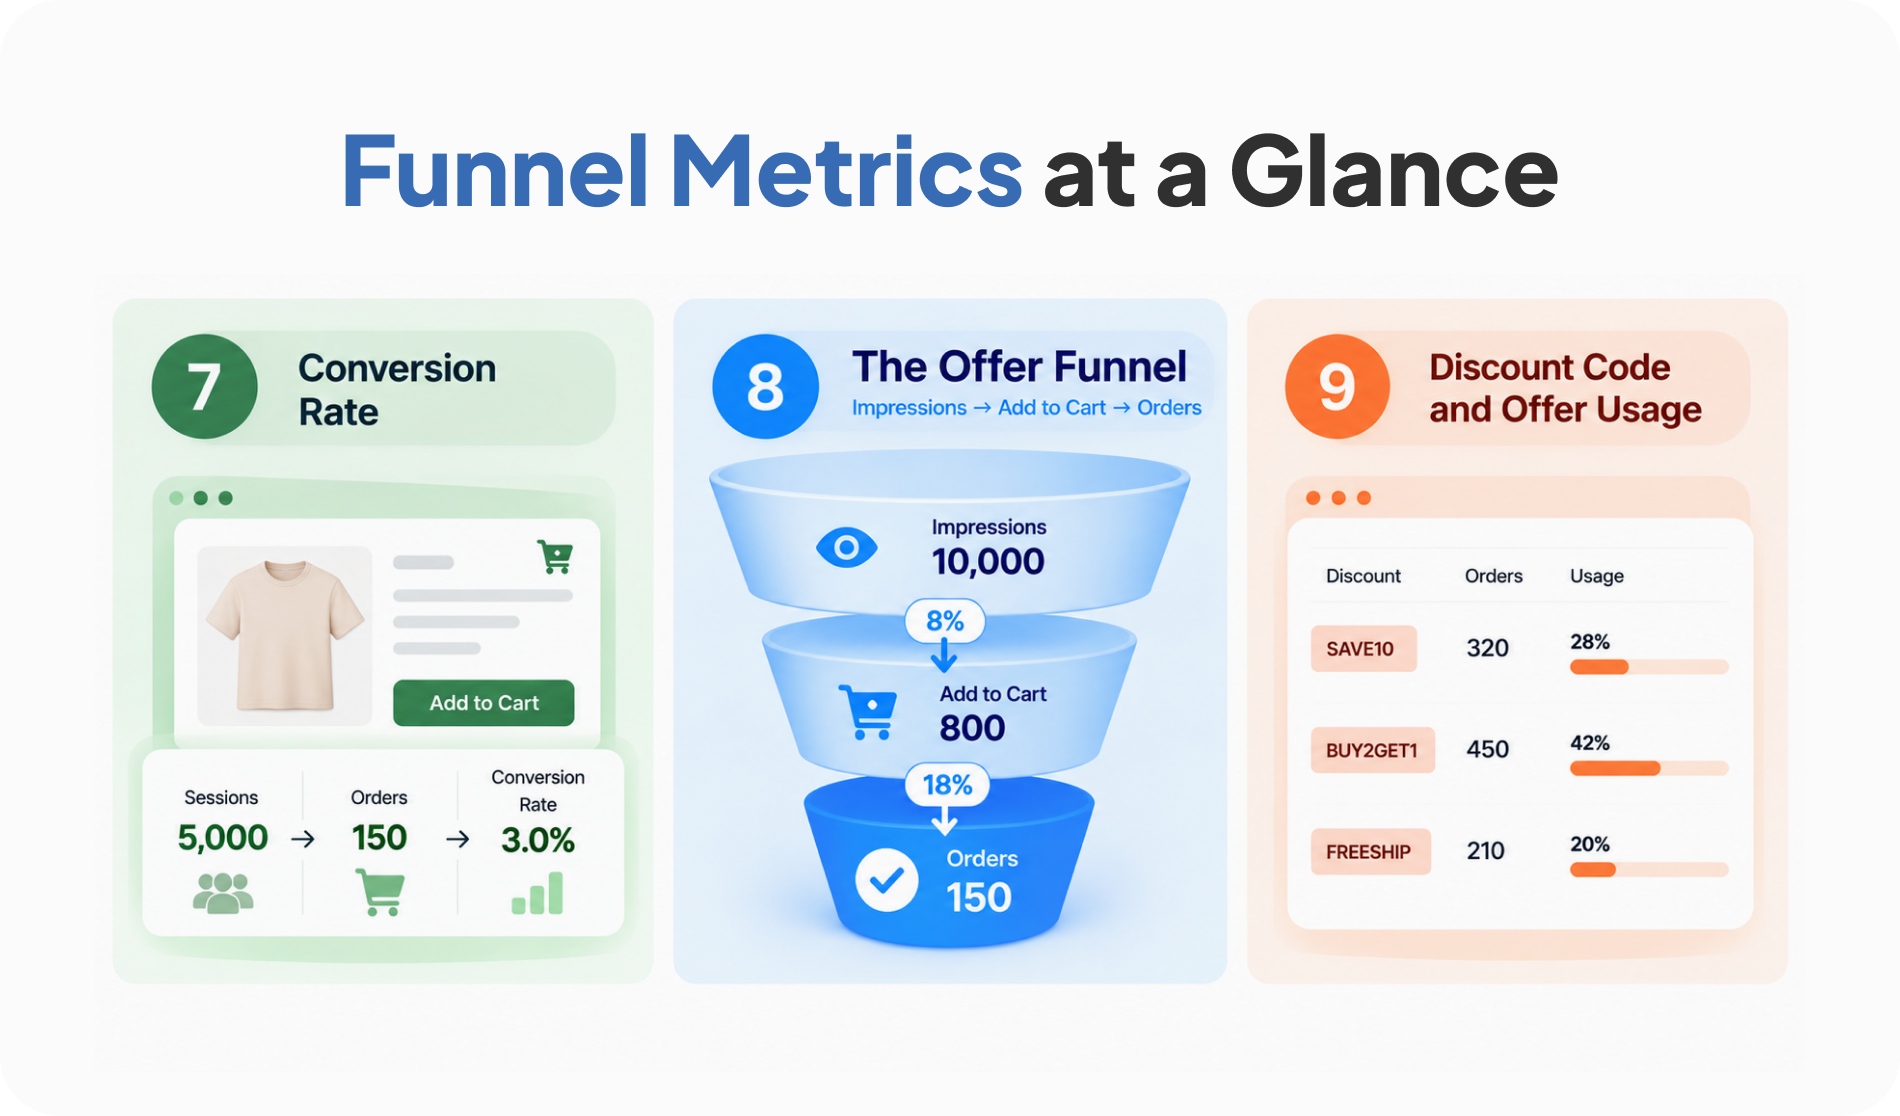
7. Conversion Rate
Orders divided by sessions. Read it alongside profit per visitor, since a generous offer raises conversion by definition and a rise alone proves little. Segment it by device and by traffic source, because a promotion announced by email lands on different shoppers than one found through search. If mobile conversion falls during a promotion while desktop rises, the cause is often a widget or layout problem on small screens. Check the product page on a phone before you change the offer.
8. The Offer Funnel: Impressions, Add-to-Cart, Orders
Pumper tracks each offer's impressions, add-to-carts, orders, revenue, and conversion rate. Read the funnel as three ratios: impressions to add-to-cart shows whether the offer is persuasive, add-to-cart to order shows whether checkout kills it, and the revenue per order shows its value.
A strong first ratio with a weak second points to checkout friction. Baymard Institute's aggregate of 50 studies puts average cart abandonment at 70.22%. Among shoppers who weren't just browsing, extra costs such as shipping, tax, and fees were the top reason for leaving, at 40% (Baymard Institute, page updated September 2025). If your offer adds to cart and then stalls, check the shipping line before you check the discount.
9. Discount Code and Offer Usage
Shopify's sales-by-discount report groups sales by discount name and shows how often each is applied. Because an order with combinable discounts can appear once per discount, the same order may be counted in several rows, so don't sum the rows to get total promotion revenue. Name your discounts clearly, and Pumper's piece on Shopify automatic discounts explains how automatic rules appear in these reports.
Customer Metrics for the Weeks After
10. New Versus Returning Share
Split promotion orders by whether the buyer had ordered before. Export the promotion window's orders, flag each customer's order count at the time of purchase, and report the share of revenue from first orders versus repeat orders. A deep tier that mostly sells to returning customers is a pricing problem you can fix by changing who sees what.
The split matters because discounts act differently on the two groups. Anderson and Simester ran three field experiments with a catalog retailer and found deeper current discounts raised later purchases from first-time customers while lowering them from established ones (Anderson & Simester, Marketing Science, 2004). A promotion that sells mostly to returning customers is the one most likely to be giving away margin.
11. Repeat Purchase Rate and the Post-Promotion Dip
Measure the share of promotion buyers who order again within 60 and 90 days, and compare it with buyers acquired outside the promotion. Also chart weekly orders for four weeks after the promotion ends, against a baseline built from the same weekdays in the four weeks before it started. The dip is the baseline minus the actual, divided by the baseline. A dip below your baseline is borrowed demand coming due.
Count the dip against the lift. If the promotion week added a given number of orders and the following weeks lost most of them, the promotion moved sales around the calendar without adding many. The guide to limited-time offer strategies covers how to track pull-forward alongside lift.
12. Return Rate and Fulfillment Cost Per Order
Return rate is returned units divided by units sold for the cohort you're studying. Shopify now labels the value of returned goods as sales reversals in its sales report, so the dollar figure sits there, while unit-level return rates come from your order and return data. Fulfillment cost per order is the shipping, packing, and handling you paid, divided by the number of orders, and a promotion that adds units raises it.
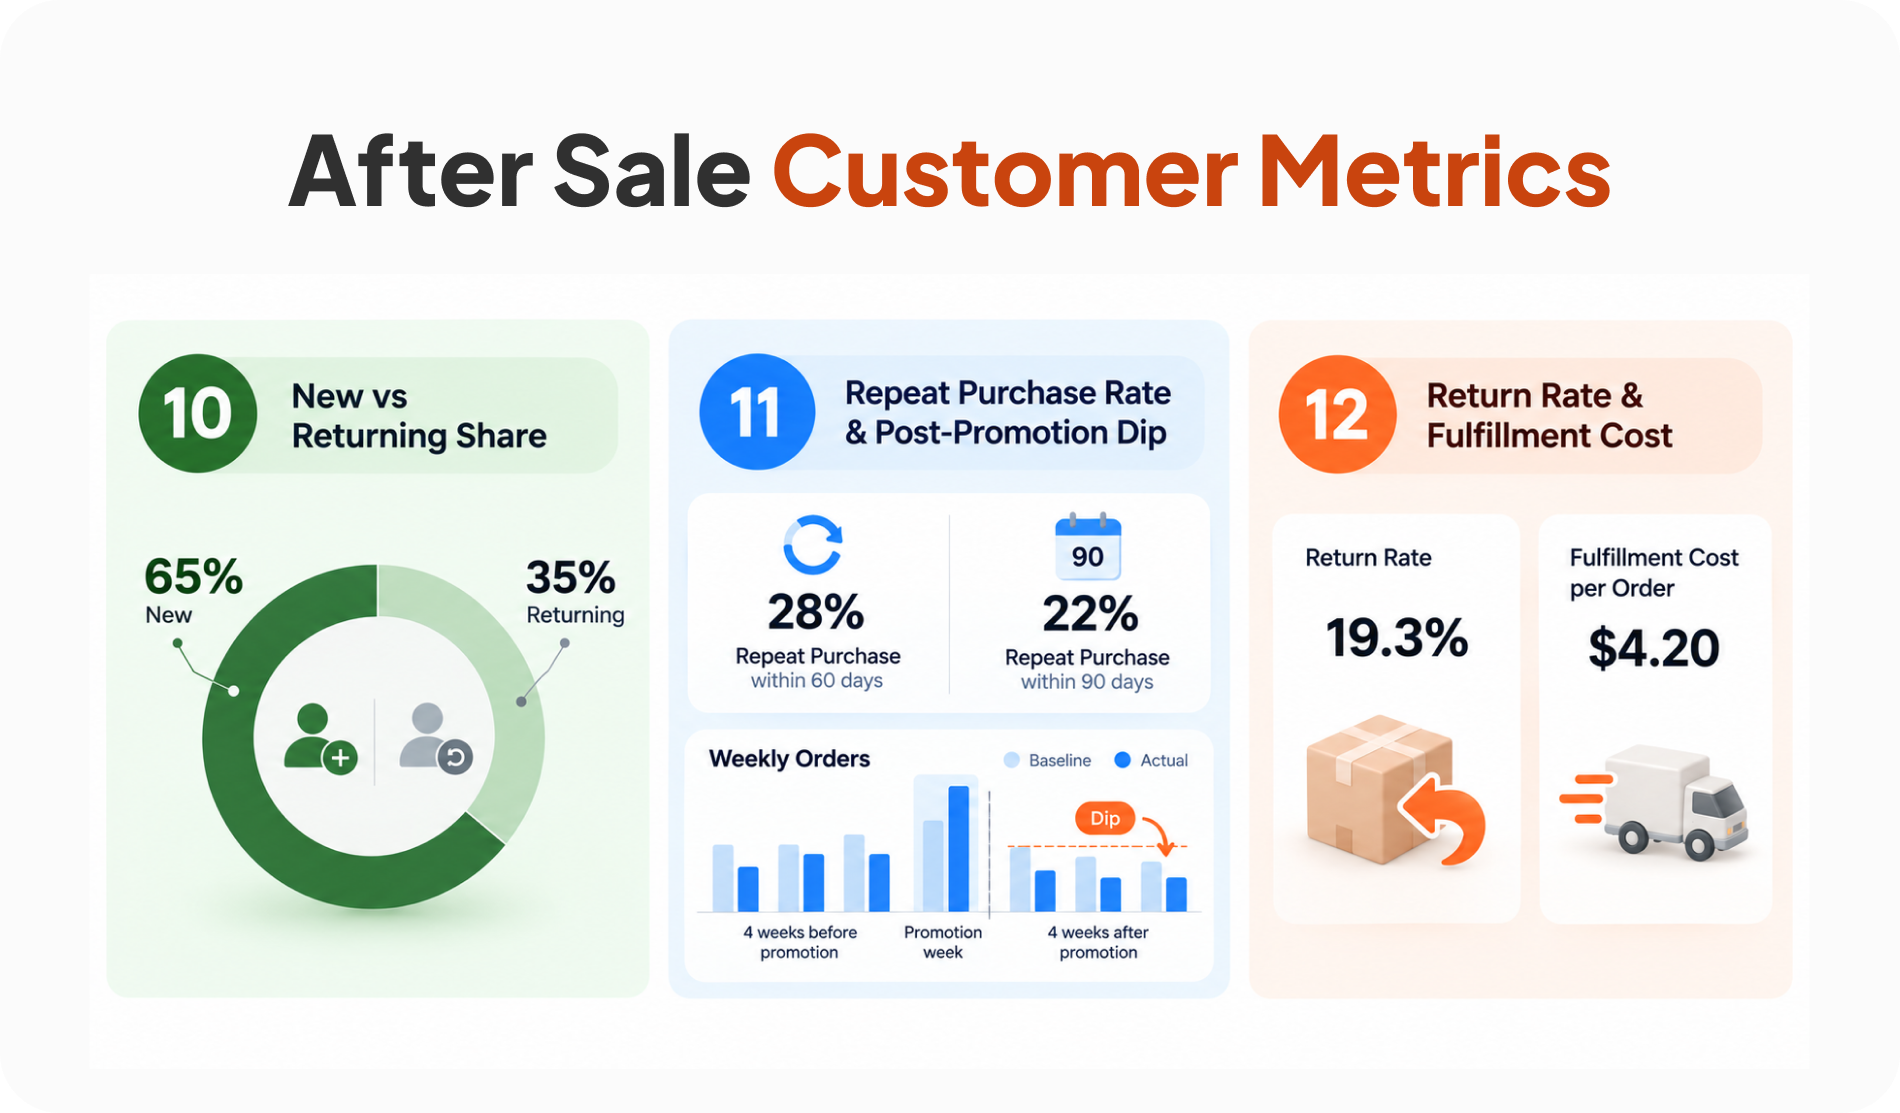
The National Retail Federation and Happy Returns projected that 19.3% of online sales would be returned in 2025 (NRF, October 2025). Promotions that add units add return chances, and shoppers who buy on a deep deal may return at a different rate from full-price buyers. Compare return rate and shipping cost per order for the promotion cohort against your baseline, and net both against the gross profit figure from metric 2. For bundles and BOGO offers, settle the refund rule in advance. If a shopper returns one item from a discounted set, the refund should reflect the discount they received, and the rule should be written into the offer terms so support applies it the same way every time.
Measuring Incrementality: What the Promotion Added
The hardest question is how much of the result wouldn't have happened without the offer. Two approaches work for most Shopify stores.
A holdout. Hide the offer from a random share of eligible traffic and compare outcomes. This is the cleanest method, and it needs enough traffic for the difference to clear the noise.
A comparison product. If you can't split traffic, run the offer on one product and track a similar product without it over the same dates. Choose a pair with similar price, margin, and traffic mix.
Either way, you can compare against a known benchmark. Van Heerde, Leeflang, and Wittink broke store promotion bumps into three roughly equal parts across four scanner datasets: brand switching, demand borrowed from other periods, and category expansion (van Heerde, Leeflang & Wittink, Marketing Science, 2004). Grocery data won't match an online store, but if your holdout shows less than the full bump is incremental, that's normal.
The Break-Even Unit Lift
Before launch, calculate the unit increase that keeps gross profit flat when the discount applies to every unit. The formula is the discount divided by the margin left after the discount (d ÷ (m − d)).
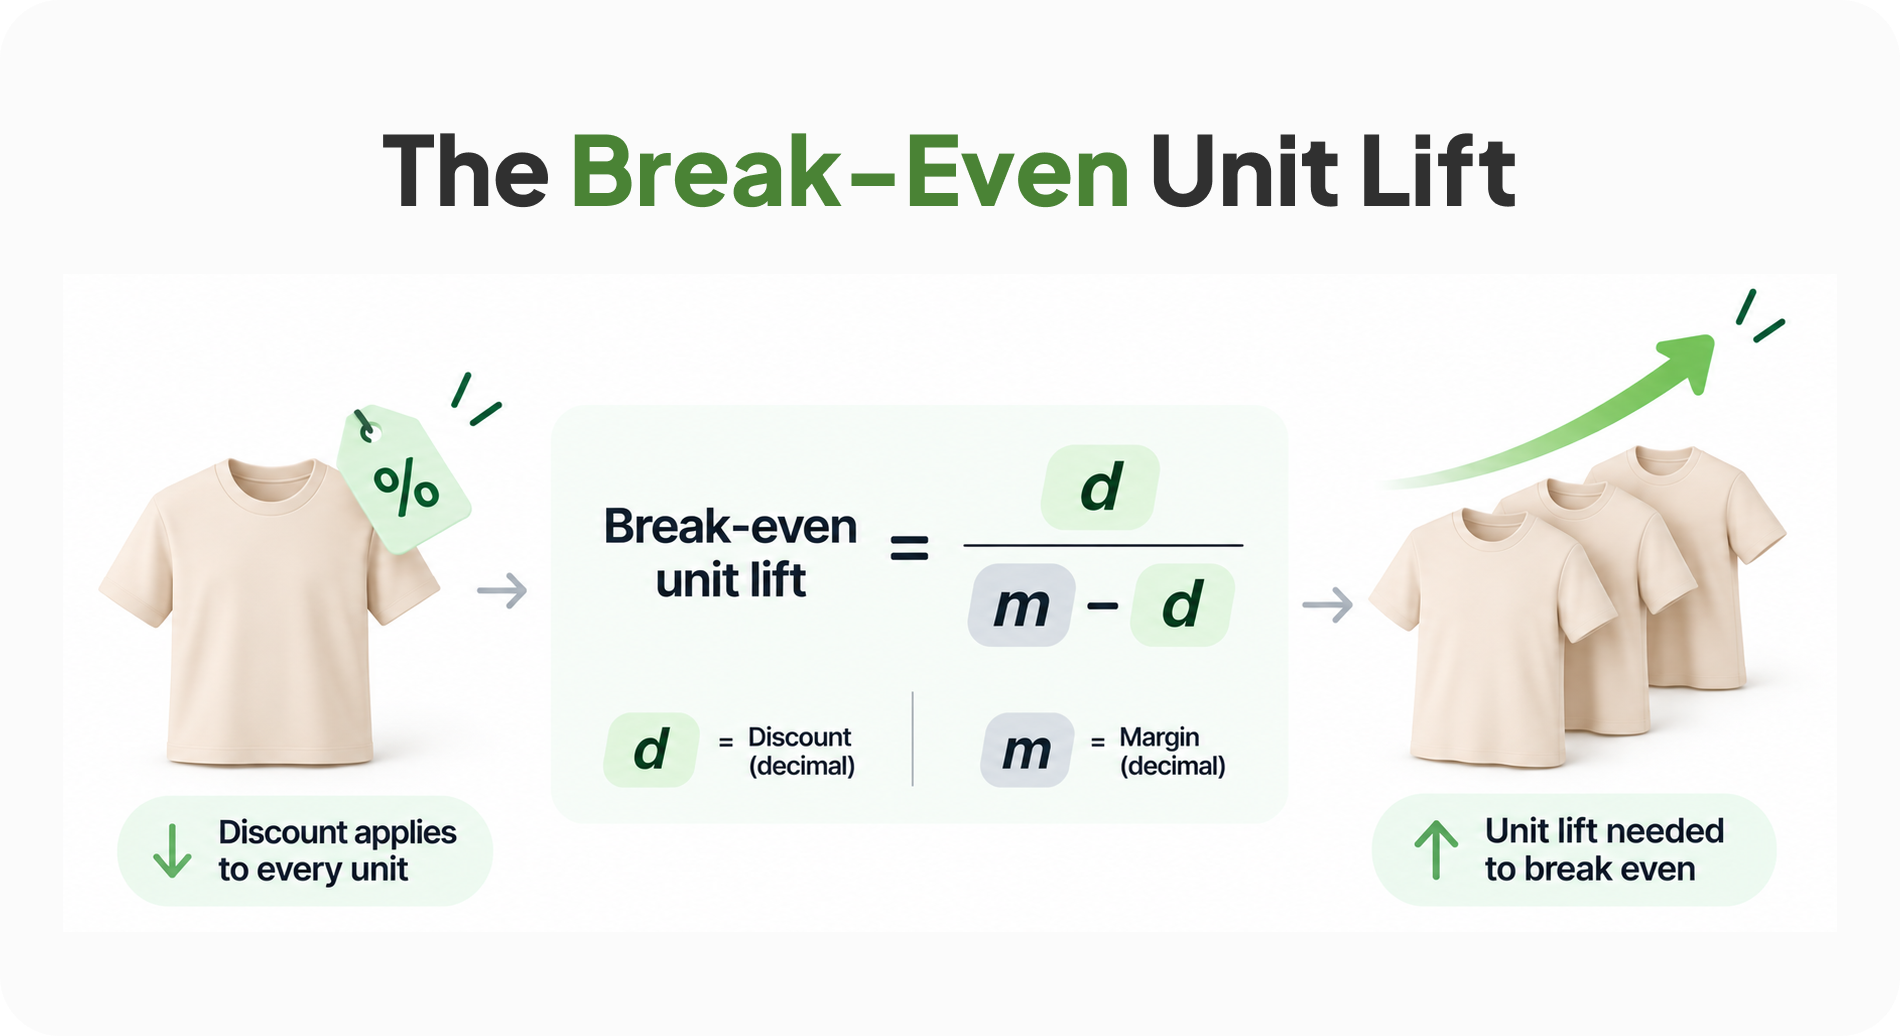
Here is the lift needed at common combinations:
If the promotion didn't produce at least that unit lift among the buyers who would have bought anyway, it lost gross profit on them. New buyers are the offset, which is why the new versus returning split matters.
Turning the Numbers Into a Weekly Habit
Review the first rows weekly during a promotion and the full table at 30 and 90 days after. Pumper's merchandising guide, the Shopify merchandising playbook, suggests a regular review rhythm that works for catalog changes as well as discounts.
Reading the Numbers Together
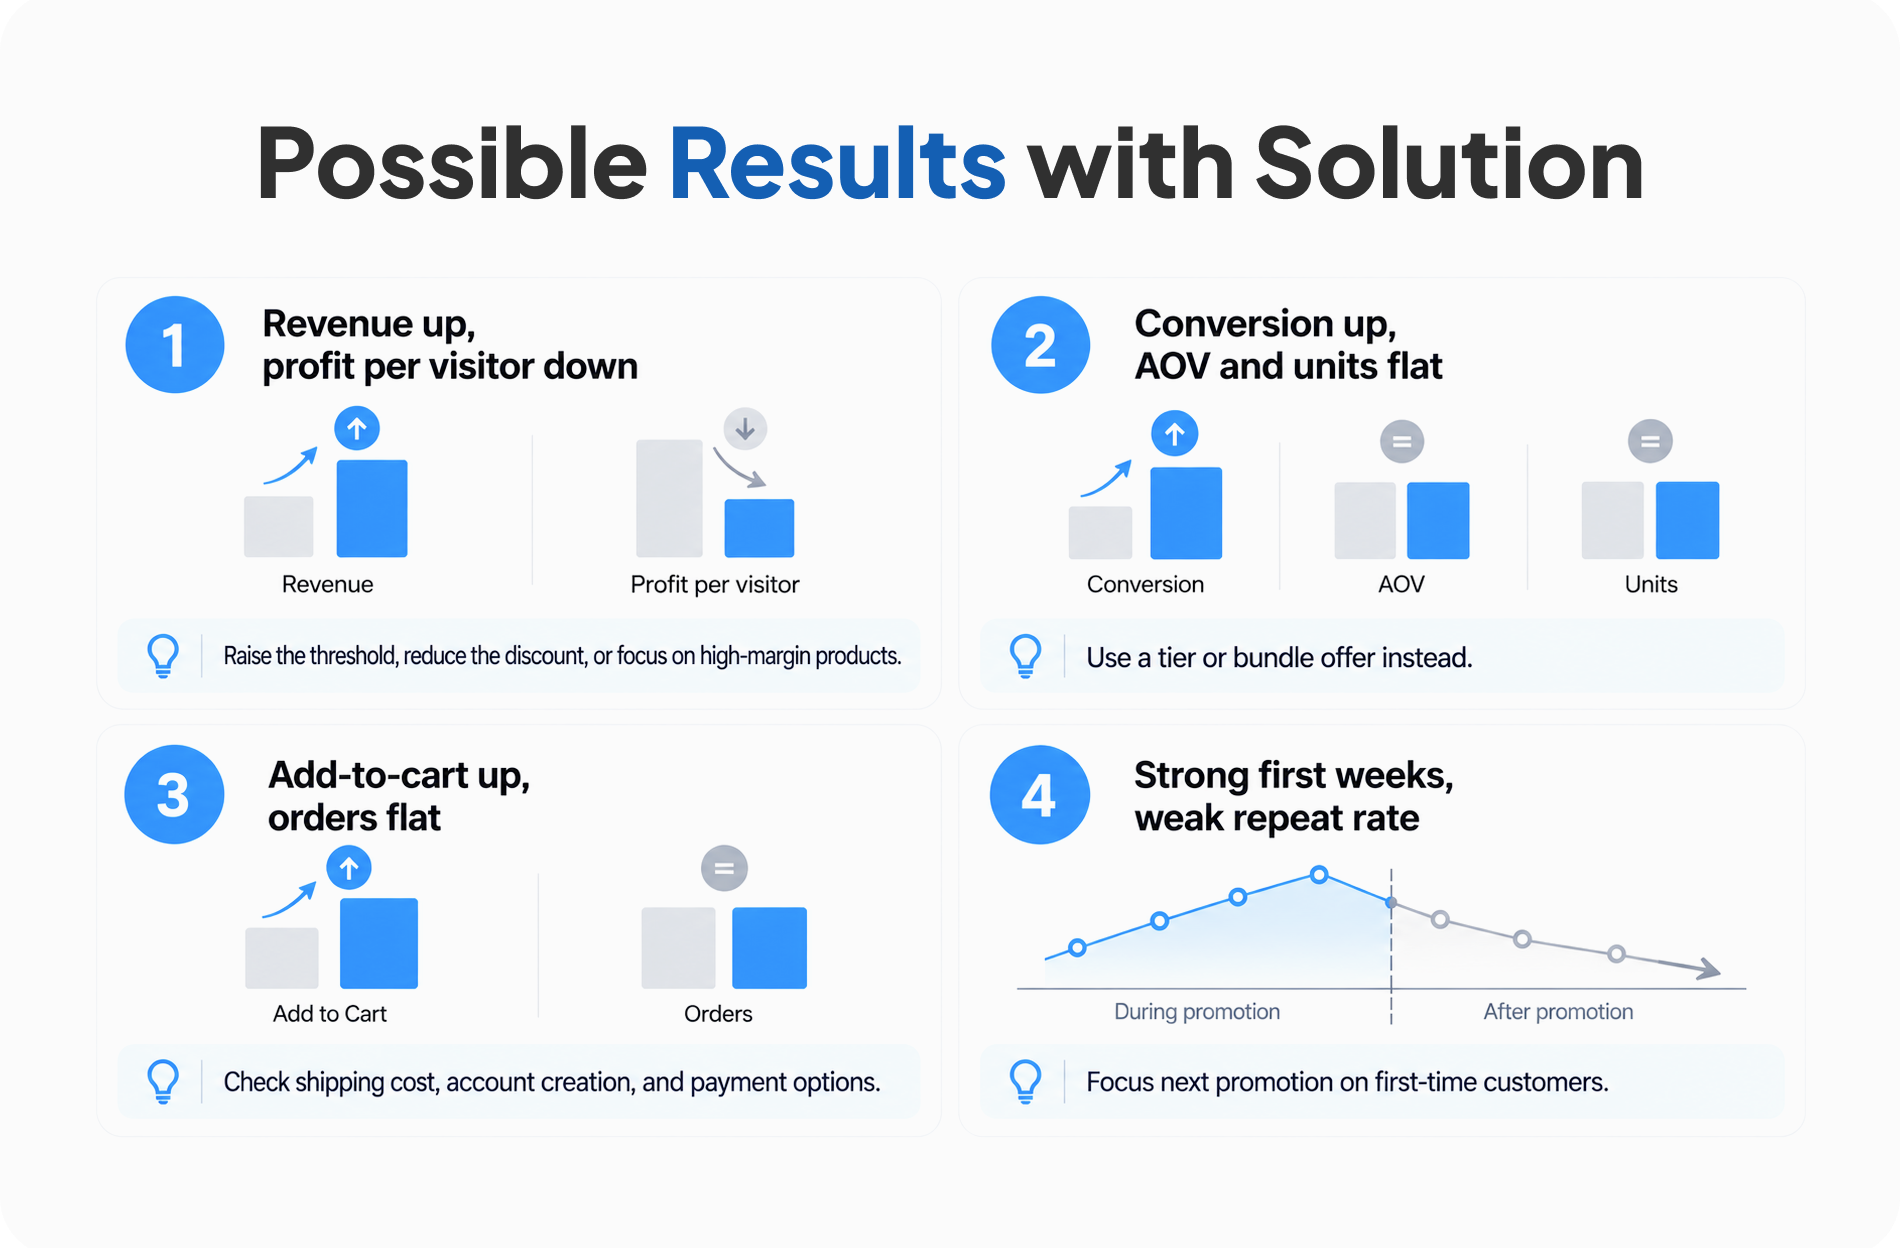
Metrics rarely move alone, and the combinations tell you what happened.
Revenue up, profit per visitor down. The discount outran the margin on the added units. Raise the threshold, shrink the discount, or restrict the offer to higher-margin products.
Conversion up, AOV and units flat. Shoppers are buying the same basket for less. This is the signature of a price cut with no quantity incentive, and a tier or bundle structure is the fix.
Add-to-cart up, orders flat. Look at checkout: shipping cost, forced account creation, payment options. The offer got attention, and something later removed it.
Strong first weeks, weak repeat rate. The offer pulled demand forward or attracted deal-driven buyers. Shift the next promotion toward first-time customers, as the Anderson and Simester results suggest, and match the offer to the customer using Pumper's guide to the psychology of Shopify promotions.
See Every Offer's Numbers in One PlaceTrack impressions, add-to-carts, orders, revenue, and conversion rates for every offer with Pumper's analytics. Get a consolidated revenue dashboard with insights for this month, the last 30 days, and all time.
|
Frequently Asked Questions
What is the most important promotion metric?
Profit per visitor, because it combines discount depth, units sold, and conversion into one figure. Revenue and conversion rate each tell part of the story, and both can rise while profit falls.
How long should I wait before judging a promotion?
Read the in-window numbers at the end of the promotion, then check repeat rate and the post-promotion dip at 30 and 90 days. A promotion's cost often arrives after the revenue.
Does Shopify show profit per visitor?
Shopify's sales reports stop at net sales, and cost data lives in the cost-per-item field. You calculate profit per visitor by combining that with session counts from the analytics reports.
How do I measure a promotion with no control group?
Compare against a similar product or period, and treat the result as a range. Use a holdout when traffic allows, since it removes most of the guesswork.
The Short List to Start With
If twelve metrics feel like too many, start with profit per visitor, discount rate, and units per order. Those three catch most of the failures: a discount that costs more than it earns, a price cut that added no quantity, and a basket that stayed the same size.
Add the funnel and customer metrics as your promotions get more ambitious, and compare offer types with the guide to Shopify promotion strategies before you choose the next one. The goal is a habit of looking at the same few numbers before and after every offer, so the next promotion starts from evidence instead of memory.
Know Which Offer Earned Its DiscountManage quantity breaks, bundles, BOGO deals, and free gifts from one dashboard. Track analytics attributed to each active offer to see which promotions drive revenue and deliver results.
|